
PORTFOLIO
Selected projects demonstrating spatial analysis, modelling, mapping, and GIS workflows used to support planning, environmental management, infrastructure investment, and community outcomes across New Zealand.
Each project is framed around the decision being supported, the analytical approach used, and the outcome delivered.
Featured capabilities include multi-criteria suitability analysis, visual impact (ZTV) assessment, accessibility modelling, population forecasting, dashboard development, GIS workflow automation, and cross-platform ArcGIS and QGIS solutions.
Spatial Analysis & Decision Support
Projects where GIS and spatial analysis are used to evaluate options, prioritise investment, assess impacts, and support evidence-based decision making.

Land Management Prioritisation Model
Decision Question:
Where should land management investment be prioritised to achieve the greatest environmental benefit?
Approach:
Multi-criteria decision analysis (MCDA) combining environmental variables such as land cover, slope, hydrology, and existing vegetation to generate a weighted suitability surface.
Outcome:
Delivered a transparent and repeatable prioritisation model that helped identify areas where land management investment would achieve the greatest environmental benefit.

Visual Impact (ZTV) & Flight Path Analysis
Decision Question:
How will proposed infrastructure or operational activities interact with surrounding terrain and visibility constraints?
Approach:
Applied viewshed (ZTV) analysis and terrain modelling using digital elevation models to assess visual impacts, sightlines, and height relationships between infrastructure, flight paths, and the surrounding landscape.
Outcome:
Provided spatial evidence supporting planning assessments, visual impact evaluations, and aviation-related decision making.

Community Accessibility & Service Catchment Analysis
Decision Question:
Which communities have limited access to essential services and facilities?
Approach:
Network-based catchment analysis to model travel distances and accessibility to key services.
Outcome:
Identified underserved areas to support equitable service planning and investment prioritisation.
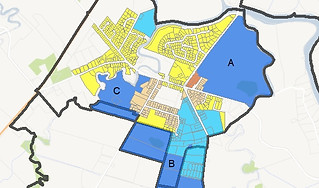
District Plan Spatial Analysis
Decision Question:
How can spatial analysis support evidence-based planning decisions and District Plan development?
Approach:
Modelled the spatial implications of proposed plan changes and integrated GIS analysis into planning and policy development processes.
Outcome:
Supported planning teams with evidence-based spatial insights that informed District Plan decisions and statutory reporting.

Population Growth & Infrastructure Demand Model
Decision Question:
How will population growth influence future infrastructure demand and spatial planning requirements?
Approach:
Integrated census data, planning zones, and growth trends into a spatial population model using multivariate analysis.
Outcome:
Supported infrastructure planning and investment decisions through spatially explicit growth forecasting.
Mapping & Visualisation
Projects focused on communicating spatial information through maps, dashboards, and interactive tools to support engagement, reporting, and understanding.

Regional Tourism Planning
Project Overview:
Mapped and validated walking, cycling, and mountain bike networks to support regional tourism planning and funding applications.
Approach:
Led both desktop and field mapping efforts, integrating spatial data to create comprehensive trail networks and accurate alignments.
Outcome:
Produced detailed maps that were instrumental in planning and securing funding for regional tourism initiatives.

Conservation Monitoring Dashboard
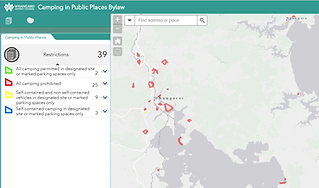
Public Engagement
Project Overview:
Developed an online public engagement web application for consultation on the proposed camping in public places bylaw.
Role & Approach:
Designed and implemented a web map application allowing the public to place pins on a map and register feedback.
Outcome:
Facilitated transparent community consultation, gathering valuable public input for policy development.
Regional Tourism Planning
Decision Question:
How can walking, cycling, and mountain bike networks be mapped and presented to support regional tourism planning and funding applications?
Approach:
Combined desktop GIS analysis with field mapping to validate trail alignments and integrate multiple spatial datasets into a comprehensive recreation network.
Outcome:
Delivered accurate and detailed trail network maps that supported planning initiatives and successful funding applications for regional tourism infrastructure.
Conservation Monitoring Dashboard
Decision Question:
How can conservation outcomes be monitored, reported, and communicated effectively?
Approach:
Developed an interactive dashboard integrating conservation group activity, treatment areas, target species, and project statistics.
Outcome:
Provided a central reporting platform that improved monitoring, stakeholder communication, and programme reporting.
Public Engagement
Decision Question:
How can community feedback be collected and visualised spatially?
Approach:Designed and implemented a web map application allowing the public to place pins on a map and register feedback.
Outcome:
Enabled location-based public participation and improved understanding of community perspectives.
GIS Workflows & Automation
Projects involving repeatable GIS workflows, data processing systems, and automation designed to improve efficiency, consistency, and analytical capability.

Legacy Catchment Data Reconstruction
Decision Question:
How can historic catchment information be preserved and incorporated into modern GIS systems for ongoing analysis and management?
Approach:
Digitised and analysed historic paper maps from the 1960s and 1970s, developing geoprocessing workflows to transform legacy information into a structured digital dataset.
Outcome:
Created a modern catchment dataset and repeatable workflow that streamlined future updates and integration with existing GIS databases.

Asset Management
Decision Question:
How can asset information be clearly communicated to support maintenance procurement and contract delivery?
Approach:
Designed GIS map templates, symbology and filters to display only the assets relevant to specific maintenance activities. Developed a repeatable mapping workflow that enables annual updates using current asset datasets and supports tender documentation requirements.
Outcome:
Delivered a suite of maintenance maps that complemented procurement and tender documentation, helping contractors understand asset locations, maintenance responsibilities, and the scope of work. Established a streamlined process for producing future updates.

Mobile GIS Field Data Collection
Decision Question:
How can field data be collected consistently and accurately to support ongoing monitoring and management decisions?
Approach:
Developed a mobile GIS workflow using open-source field applications, device GPS, and aerial imagery to locate and record soil sampling sites. The workflow standardised data collection and ensured sampling locations could be accurately revisited during future monitoring programmes.
Outcome:
Established a repeatable field data collection process that improved data quality, supported long-term monitoring, and provided a framework that can be adapted for environmental monitoring, ecological surveys, asset inspections, and other field-based GIS applications.
Platform Work (ArcGIS & QGIS)
Examples of cross-platform GIS delivery supporting client systems using both ArcGIS and QGIS environments.

ArcGIS & QGIS Project Delivery
Decision Question:
How can GIS projects be delivered in an open-source environment while maintaining consistency and usability?
Approach:
Developed structured QGIS projects incorporating standardised layers, symbology, forms, and workflows.
Outcome:
Provided clients with maintainable GIS projects tailored to operational requirements.